An Animal Card Set for Teaching Classification (Unplugged)
By Claire M. Wong and Stephanie Rosenthal
Carnegie Mellon University
| Concept | Description |
|---|---|
| Summary |
|
| Topics | Features
|
| Audience | The target audience of these cards are kids and adults with limited to no Machine Learning background and no required computer science background. |
| Difficulty | Easy |
| Strengths | Adaptable, hands-on, unplugged, relatively quick interaction experience with working with a comfortable dataset on animals |
| Weaknesses | Potential for some teens and adults to know what makes a mammal a mammal or a bird a bird can make the activity potentially too easy. However, we have found that even when adults know the categories, they still value the activity to learn about making classifiers. |
| Dependencies | Printer to print out the cards, and scissors to cut them apart. Cards should be cut on the black lines into 6 pieces per page. Do not print double-sided. It is recommended to print on cardstock. Instructors could use magnet tape on the back to be able to use them on a whiteboard. |
| Variants | Instead of a decision tree, teachers could have students plot or place the animals on a graph to look at the clusters of animals with particular combinations of features, and potentially to draw a linear classifier to distinguish classes.
|
| Materials | Animal Cards with Decision Tree Materials pptx pdf
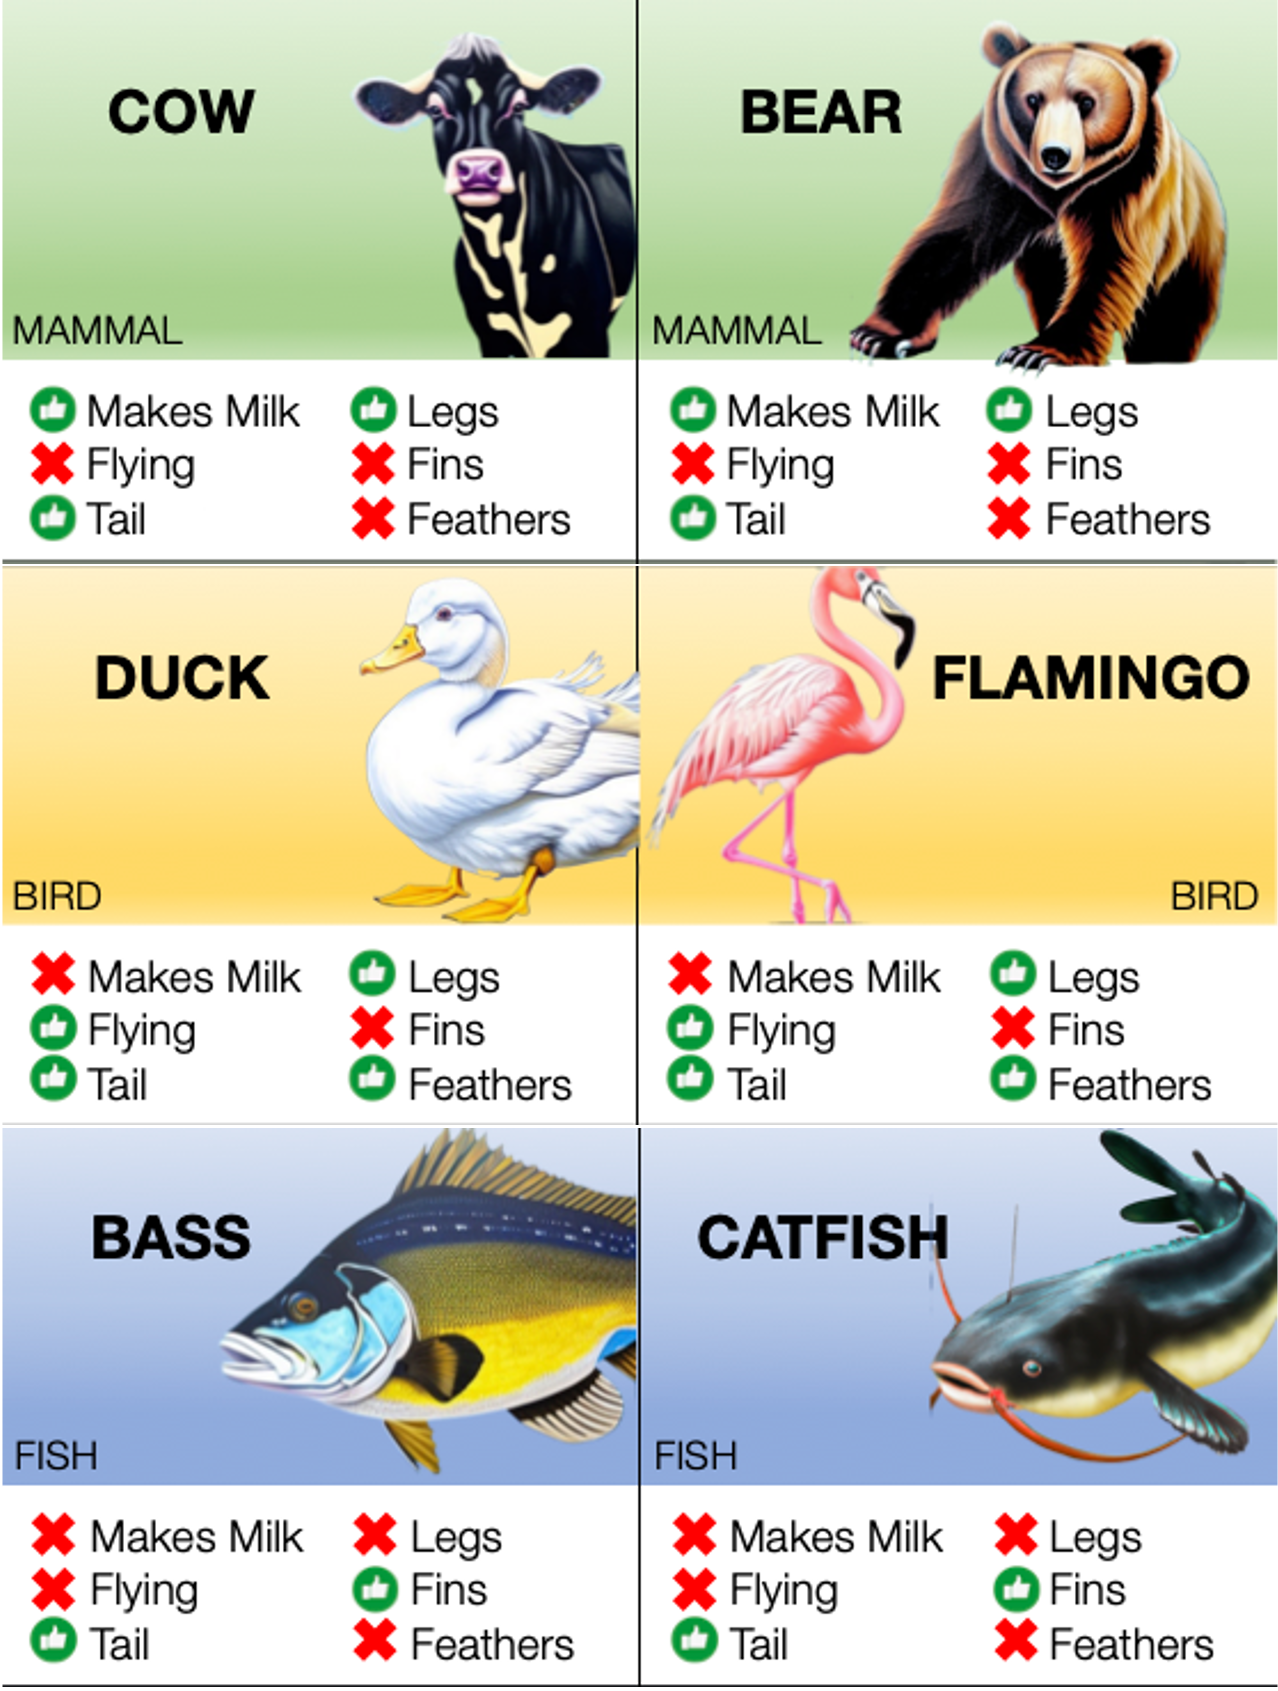
Preparation of the activity: The instructor should separate the sheets of animals into 36 cards (animal with their corresponding features) as well as any other materials for the classification algorithms (decision tree arrows and feature names are provided, though they may want to try a linear model for more advanced students). It is the instructors choice whether to include all 3 classes of animals (mammal, bird, fish) or only 2 classes. In an opaque envelope, place 7 animals as the hidden test set. Note: there are some special/anomalous animals in the mammal and bird classes of the dataset. Most mammals in the set have legs, walk on land, and do not fly; however bats and dolphins are also mammals so their features are a little different from the rest. Similarly, most birds have feathers and fly, but penguins and ostriches do not fly. In an easy test case, the animals are chosen to reflect the distribution of data (e.g., most mammals have legs, so the test data should be mostly legged mammals); students will be able to see the anomalies in the training set and change the their classifier to reflect the diversity of the data. In a harder test case, instructors should choose all of the anomalous animals as test data. The students will likely "overfit" their model to the data they have seen, and their models may have testing errors due to the bias in the training data which the teacher can discuss. Background content to cover: The instructor should have discussed what data is and the goals of classification in machine learning. In our course, we cover the general goal of classification, features, and different types of classification algorithms -- Support Vector Machines, Decision Trees, K Nearest Neighbors, and Neural Networks -- briefly. Ideally, the instructor should have introduced the topics of training data and testing data and the purposes of separating data. Presentation of the activity: The activity is explained as follows. Students are told that they need to build a model to classify animals into the categories that the instructor has chosen. Each animal has specific features -- whether or not they have legs, a tail, feathers, fly, make milk, and fins -- indicated by thumbs up and X symbols. Students can only use the features provided to categorize the animals. For the decision tree, we show a picture of a flow chart and how it is used; each decision point should have a feature and if the feature is thumbs up it moves to the left down an arrow and otherwise it moves right down a different arrow. As a hint, we tell the students that they should be looking for features that are the same for all the animals in the category and different from the animals in other categories. They can use that set of features to work on making a decision tree that separates those categories using those features. Activity, reflection and discussion: We allow students to work for 10-15 minutes on their decision trees and walk around the classroom correcting any trees that are organized incorrectly. Often, students try to figure out the features to determine the animal name and not the class. Sometimes, they'll make really deep decision trees and we try to ask if there is a way to make it shorter (and talk about model bias and variance) (examples below). For reflection, we talk about using training data to find the best fit model for the task. If using more than one model, the instructor could ask students to compare those models for accuracy, difficulty in creating, etc. 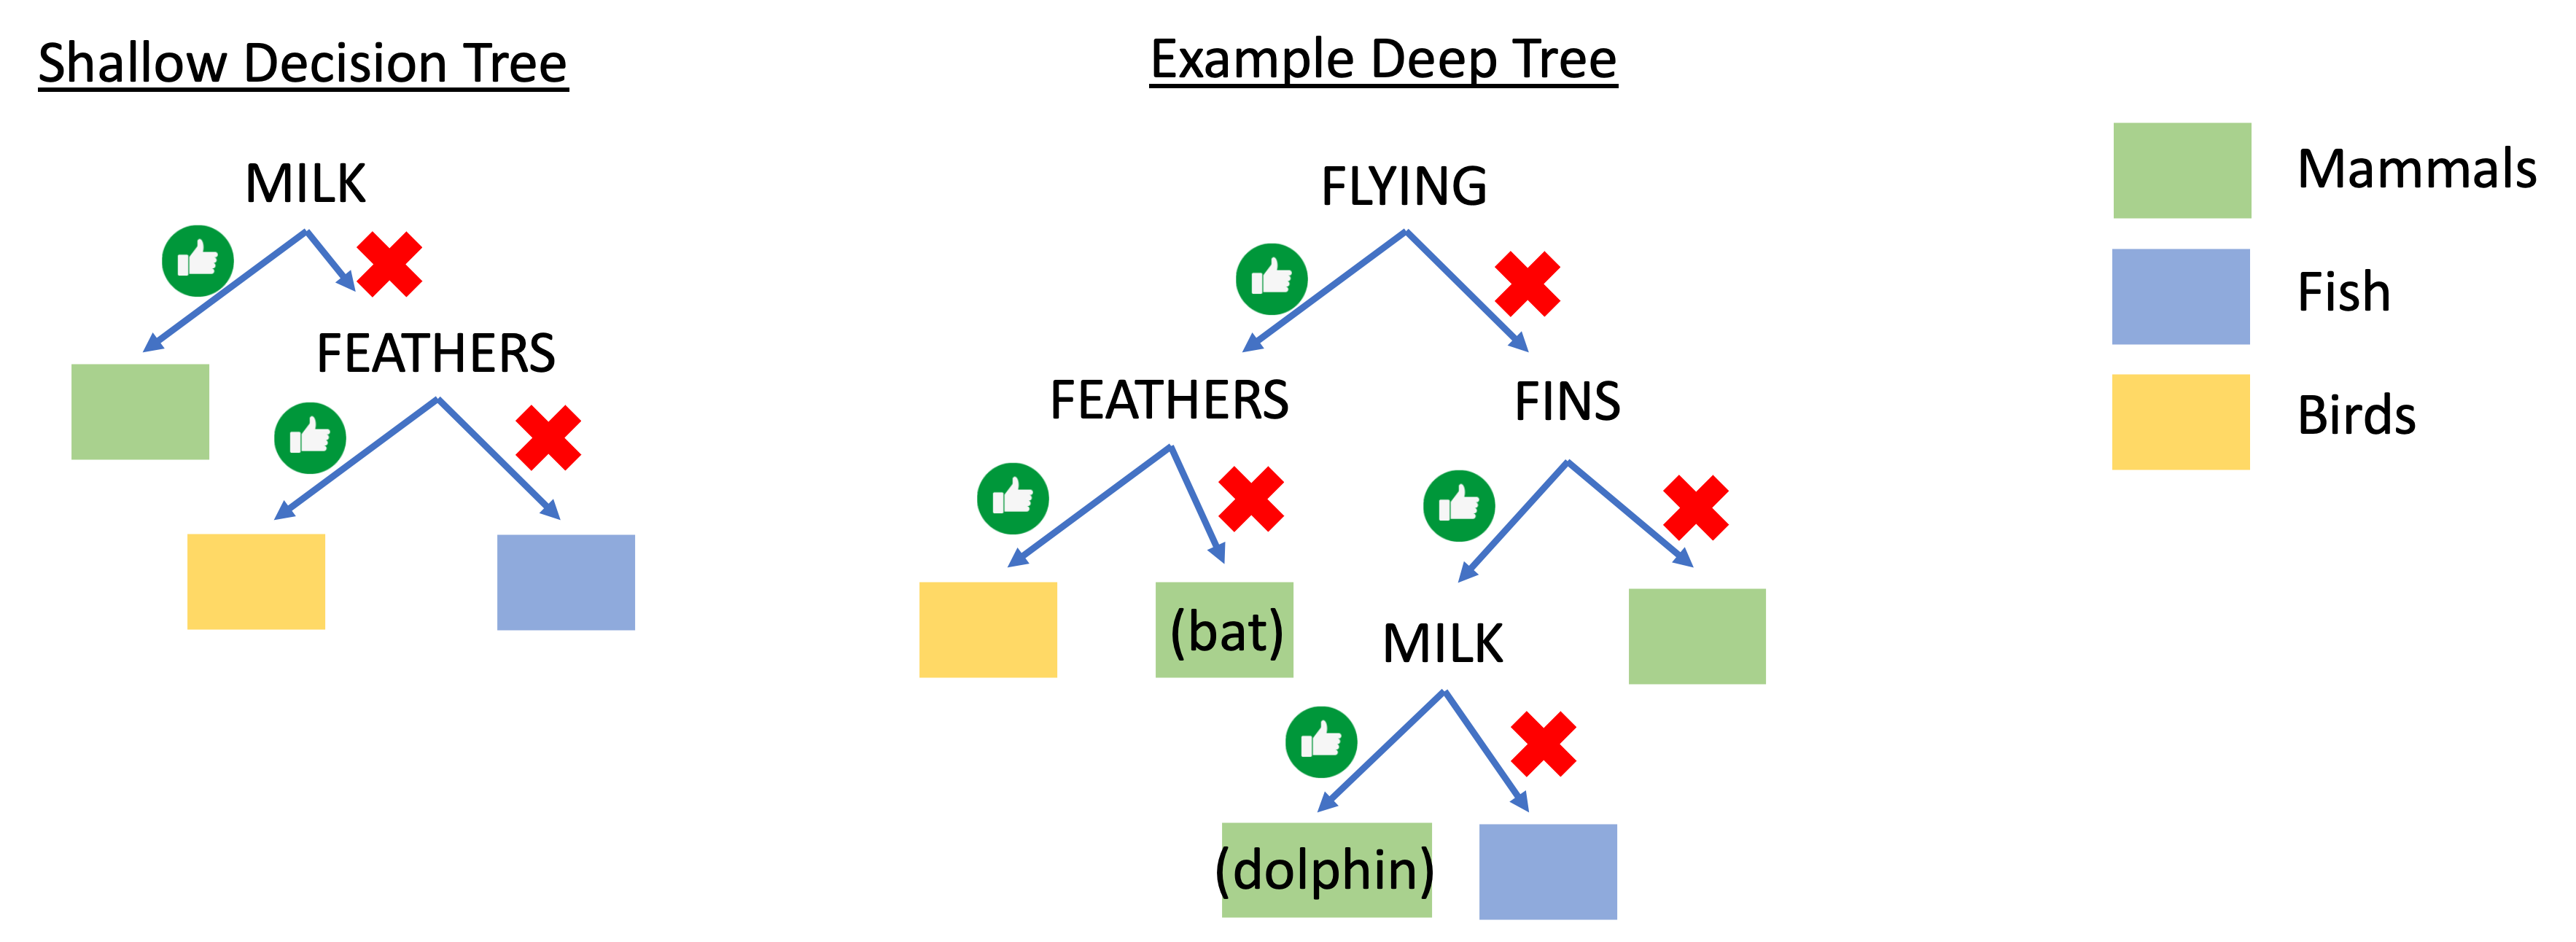
When students believe that their decision tree correctly classifies all their training animals correctly, we allow them to open their test set and see how they did. If they are accurate, we ask what features they used and how they were able to figure that out and what would happen if the training set looked different. If their model was inaccurate, we start to talk about potential bias in the data (especially if we used the hard test set), and also about the challenges of collecting enough data that represents the distribution of animals in the class. |
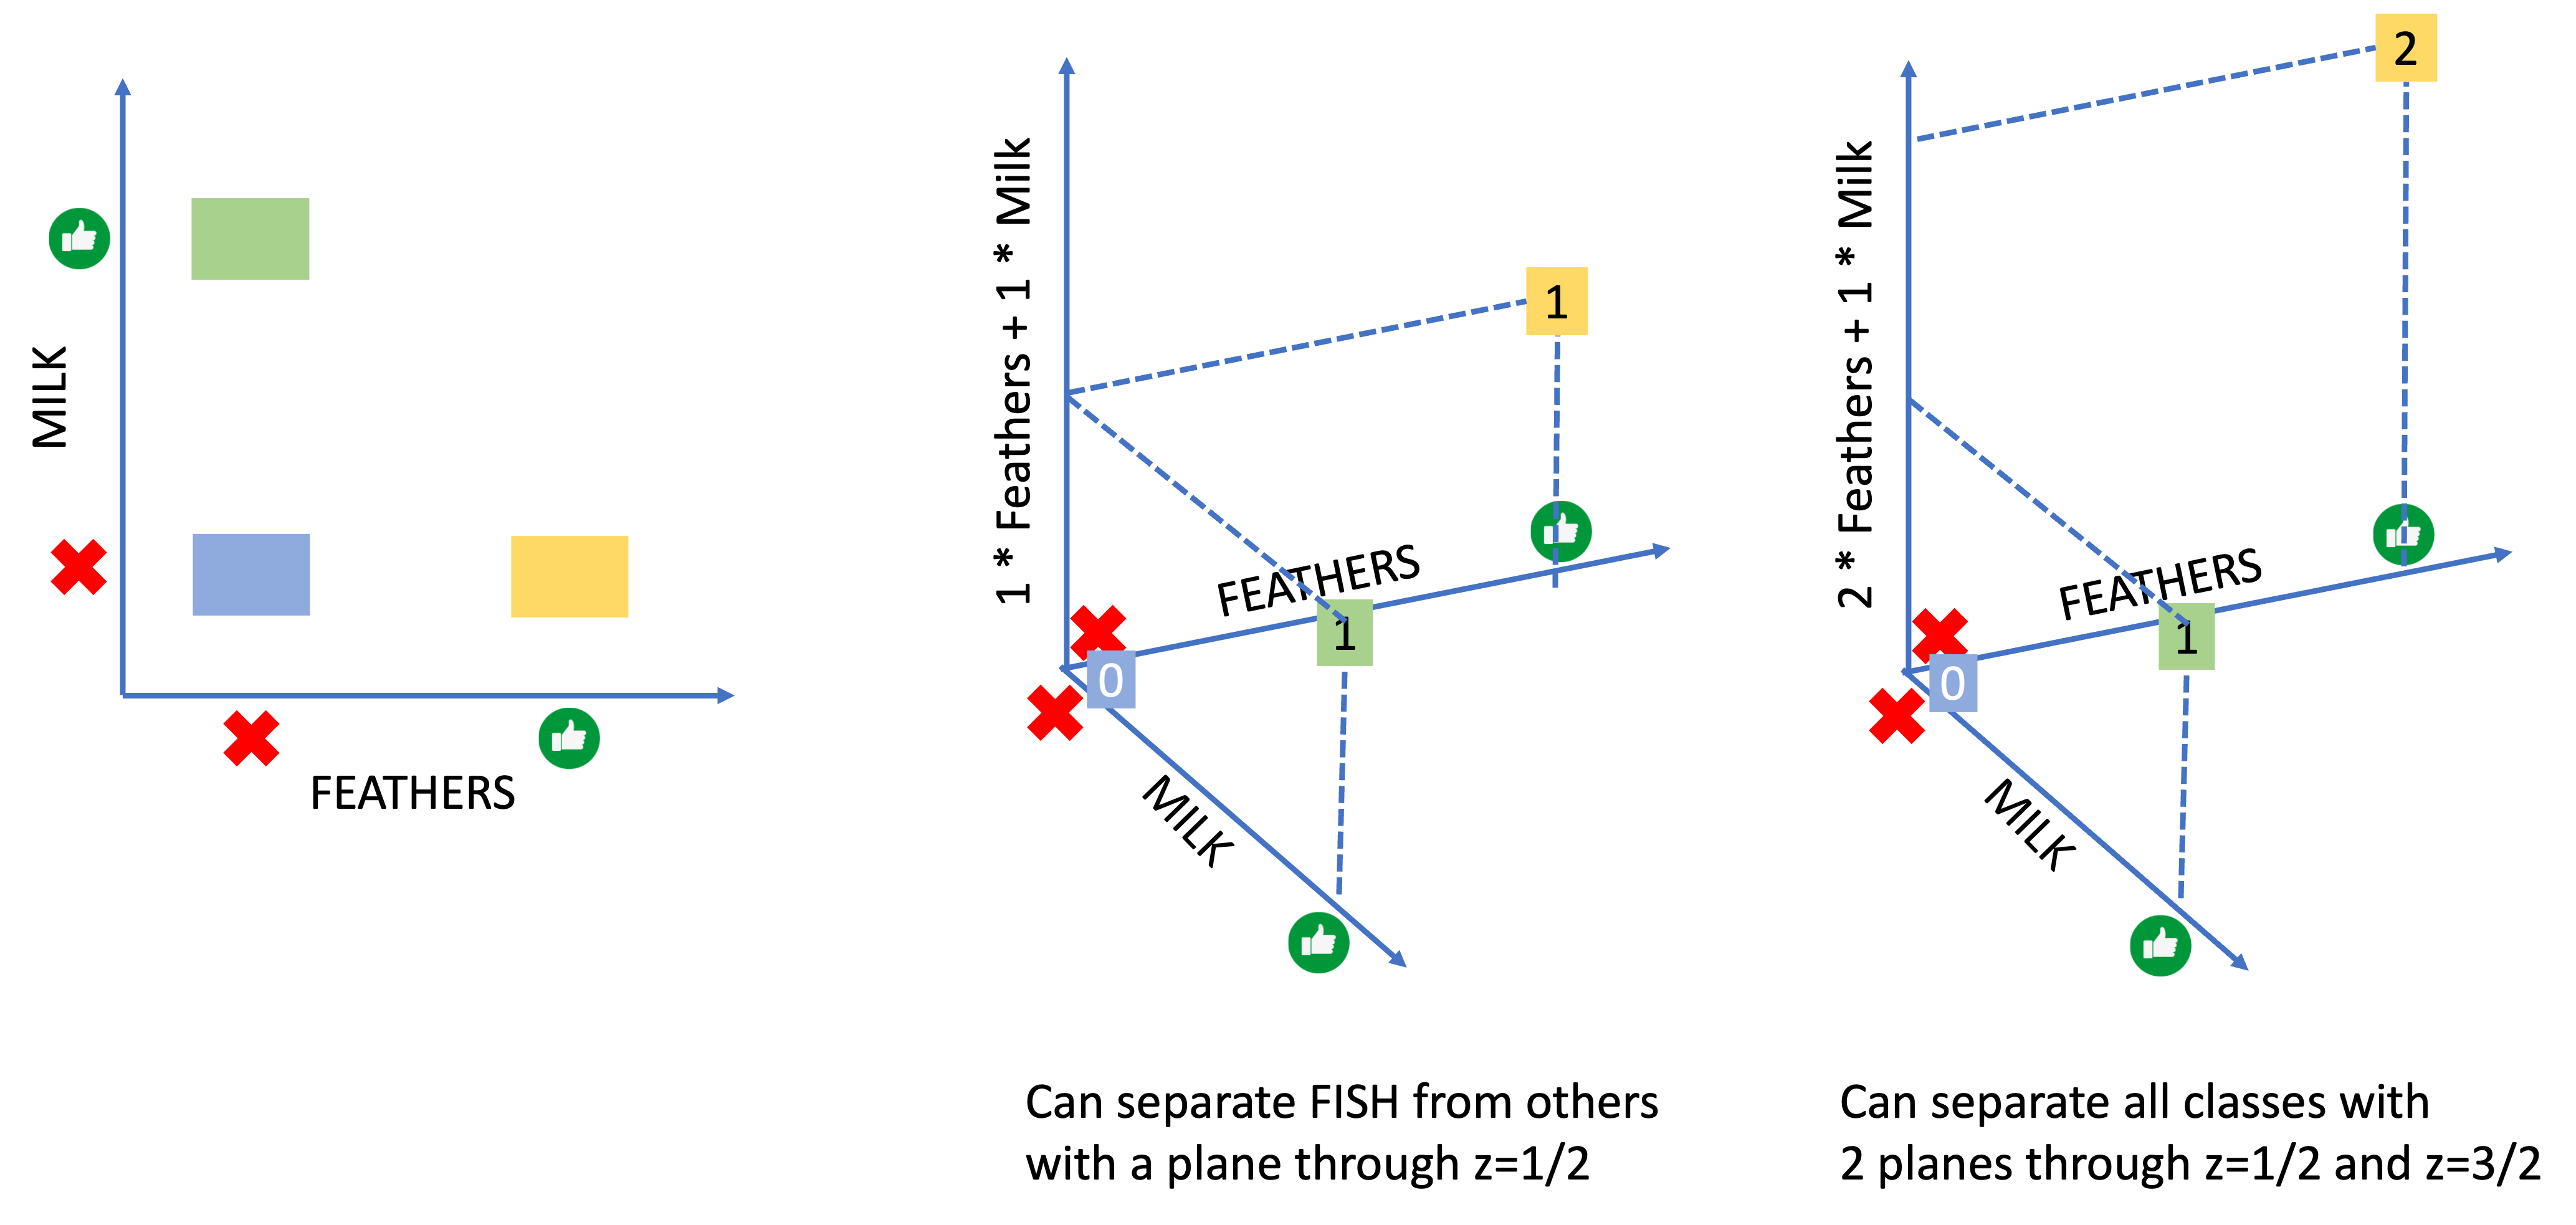
| Graphing and Linear Models | Instructors may also choose to have students graph the animals based on the features (0 for negative features and 1 for positive ones). With just two features, all of the animals fall into one of three coordinates (Figure left). Other combinations of features result in different graphs. If students can graph in 3 dimensions, they can use X and Y coordinates for the feature values and the Z axis as the value of the linear combination of those features. Then, they can make rules for classification from the values of the Z axis. Two example linear combinations are shown below (Figure center and right)
|
 Teaching machine learning can be challenging when students cannot visualize the data
that they are modeling. We designed a set of cards that describe features of 36 animals of the classes mammal, bird, and fish. The features of the animals are drawn from the
Teaching machine learning can be challenging when students cannot visualize the data
that they are modeling. We designed a set of cards that describe features of 36 animals of the classes mammal, bird, and fish. The features of the animals are drawn from the